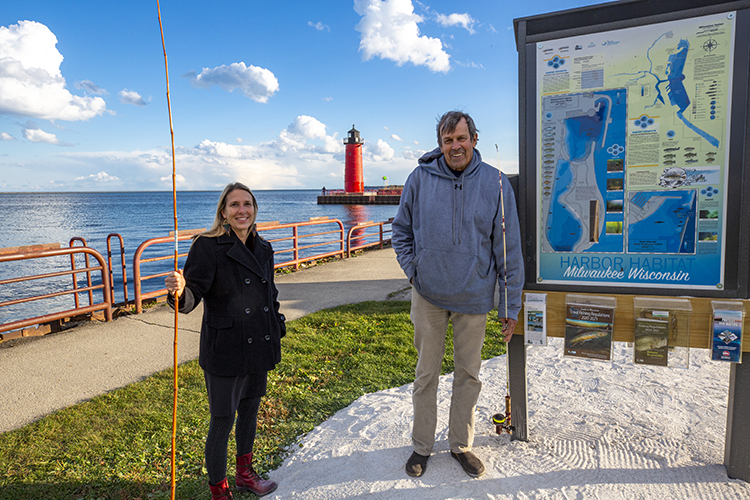
Four years in the making, a unique set of maps that show what lies under the water’s surface in the Milwaukee harbor is now available both online and on signage posted at two outdoor locations near the shore.
The maps are guiding current restoration efforts that could help get the city’s harbor removed from the U.S. Environmental Protection Agency’s list of “areas of concern,” and stimulate the local economy. The creators, researchers from the University of Wisconsin-Milwaukee, also say the project serves as a model for developing a tool to help improve the health of other urban harbors and estuaries.
The idea for a harbor habitat survey was born when the Wisconsin Department of Natural Resources sought information that would help make a harbor degraded by urban development more attractive for fishing and recreation.
Multiple state agencies and nonprofits were also interested in such a map to help them make decisions about what projects they will undertake.
In 2016, John Janssen, a professor in UWM’s School of Freshwater Sciences, and his then-graduate student Brennan Dow received funding from the Fund for Lake Michigan and DNR. The two combined side-scan sonar, a method of gathering information about the depth and physical composition of the waterbed, with diving to identify the locations and activities of fish populations.
Kim Beckmann, a UWM associate professor of design & visual communication, translated the data collected into visually appealing maps with brilliant illustrations and easily digestible text so the information could be shared with the public.
Finding problems
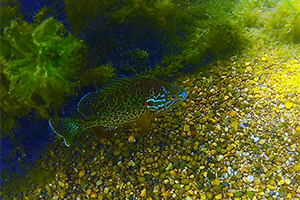
The scientists’ data showed that more of the underwater landscape is fish-friendly than they thought it would be, said Janssen, but the areas fish use for spawning, hiding from predators and feeding were spread out and isolated. Expanding and connecting these areas can better sustain fish populations, so Janssen and Dow also compiled a list of suggested projects to accomplish that.
“Think of it like it’s a fish tank,” said Dow, who is now Milwaukee Estuary Area of Concern coordinator for the DNR. “The capacity of the Summerfest Lagoon is good, but the issue is there isn’t the right amount of habitat to support all those fish.”
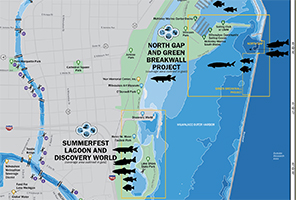
An example, he said, involves linking one hotspot, where bass are spawning in the Summerfest Lagoon, to another hotspot across the harbor at the breakwall where an abundance of tiny invasive shrimp could provide food for baby fish. Bridging the two spots can be done by adding physical structures, such as rocks, gravel and vegetation, Dow said.
Education was another primary goal, said Beckmann, the maps were reproduced on canvas and supplied to Milwaukee Public Schools. They also hang at Discovery World Science and Technology Museum downtown and are part of the American Geographical Society’s collection at the UWM Libraries.
“Having this tool also helps us understand the impact that our lives have had on life under the water,” Beckmann said. “The environment that we accidentally create or the one we harm or restore, all of that impacts what the fish do.”
51 fish species
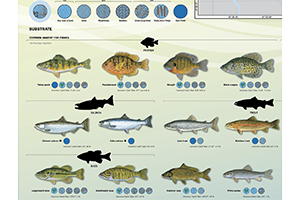
Fifty-one species of fish that inhabit the harbor, and the three rivers connected to it, are represented, along with seven habitat classifications. She highlighted 16 varieties of fish on the main map with facts like the kind of substrates each prefer, their diets and their habits.
The maps include works by nature photographer Jim Edlhuber and illustrations by Stevens Point artist and naturalist Virgil Beck. “It’s a wonderful marriage of science and art,” Beckmann said.
Deciding what to include was difficult, so she gathered comments on early versions of the maps from the public attending events such as the Harborfest, Wisconsin State Fair and Open Doors Milwaukee. Viewers usually found a significant place on the map, including fishing spots, that then sparked storytelling about their experiences.
“Stories from the public were really interesting,” Beckmann said. “They would begin by talking about experiences above the water at a particular beach and then progress to talking about fish and life under the water.”
Healthier waters can boost economy
The maps and survey data were done in consultation with the Harbor District, Milwaukee Estuary AOC Fish and Wildlife Technical Advisory Committee, and the Army Corps of Engineers, all of which are interested in different aspects of the harbor’s features. DNR’s objective is to address AOC impairments which will lead to a healthier ecology. And that, said Dow, has the potential to generate an economic return on investment.
Since 2010, funding for DNR’s remediation projects in the Milwaukee harbor has come largely from the federal Great Lakes Restoration Initiative. A 2018 study by the University of Michigan showed that, between 2010 and 2016, every $1 of spending on GLRI projects produced at least $3.35 in additional economic activity in the Great Lakes region, and the model the study’s authors produced could predict similar return on investment through 2036.
Now that the Milwaukee harbor maps are completed, Beckmann has begun working with stakeholders on similar maps for four more harbors along Wisconsin’s Lake Michigan coast — Port Washington, Sheboygan, Two Rivers and Manitowoc.